Bank of America Stock Analysis: Strong 2025 Performance and Positive 2026 Growth Outlook
Bank of America Corporation (NYSE: BAC) closed out 2025 with a solid fourth quarter, reinforcing its position as one of the strongest large-cap U.S. banks heading into 2026. The company delivered $7.6 billion in 4Q25 net income, with EPS of $0.98, up 18% year over year, supported by accelerating net interest income, steady expense discipline, and resilient consumer and corporate activity. For the full year, net income reached $30.5 billion, up 13% year over year, while EPS climbed 19% to $3.81.
Fundamental Strength: A Deep Dive into the 4Q25 Results
In the fourth quarter, revenue, net of interest expense rose 7% year over year to $28.4 billion ($28.5 billion FTE), driven by higher net interest income, asset management fees, and solid sales and trading results. Net interest income (NII) increased 10% year over year to $15.8 billion ($15.9 billion FTE), supported by Global Markets activity, fixed-rate asset repricing, and higher deposit and loan balances, partially offset by the impact of lower interest rates. Noninterest income increased 4% year over year to $12.6 billion.
Credit quality trends improved sequentially and year over year. Provision for credit losses declined to $1.3 billion, down from $1.5 billion in 4Q24 and flat versus 3Q25. Net charge-offs fell to $1.3 billion, decreasing from $1.5 billion in 4Q24 and $1.4 billion in 3Q25.
Expenses remained controlled despite continued investment. Noninterest expense rose 4% year over year to $17.4 billion, driven by higher revenue-related incentive and transaction expenses and technology investments. Efficiency improved meaningfully, with the efficiency ratio declining to 61%, a 194 bps improvement year over year. Operating leverage was a positive 3.3%, underscoring revenue growth outpacing expense growth.
Return metrics declined modestly quarter over quarter and increased modestly year over year, with return on average common shareholders' equity ratio of 10.4%, compared with 11.4% in 3Q25 and 9.6% in 4Q24, and return on average tangible common shareholders' equity ratio of 14.0%, compared with 15.3% in 3Q25 and 13.0% in 4Q24.
Balance Sheet Strength and Capital Returns
Bank of America exited the quarter with a strong liquidity and capital position. Average deposits balances of $2.01 trillion, up 3% year over year, marking the 10th consecutive quarter of sequential growth. Average loans and leases of $1.17 trillion, up 8% year over year, with growth across every business segment. Average global liquidity sources of $975 billion. CET1 ratio of 11.4% (Standardized) vs. 11.6% in 3Q25; well above regulatory minimums.
Shareholder returns remained a priority, with $8.4 billion returned in 4Q25, including $6.3 billion in share repurchases and $2.1 billion in dividends. Book value per share rose 8% year over year to $38.44, while tangible book value increased 9% to $28.73.
Segment Performance Highlights Reinforce Diversification
Consumer Banking remained the largest earnings contributor, generating $3.3 billion in Q425 net income on 5% revenue growth. Card spending rose 6% year over year to $255 billion, average deposits stayed stable at $945 billion, and digital engagement continued to deepen, with 69% of sales digitally enabled.
Global Wealth and Investment Management posted 10% revenue growth to $6.6 billion in Q425, driven by 13% growth in asset management fees. Client balances rose to $4.8 trillion, up 12% year over year, supported by positive net client flows and higher market valuations.
Global Banking delivered $2.1 billion in Q425 net income, supported by higher treasury service charges and leasing-related revenue, while maintaining a 50% efficiency ratio.
Global Markets reported $1.0 billion in Q425 net income, with sales and trading revenue up 10% year over year. Equities trading stood out, with 23% growth, marking the 15th consecutive quarter of year-over-year growth.
2026 Outlook: Earnings Momentum Continues
Management expects FY26 NII (FTE) to grow 5%–7% year over year, with 1Q26 NII (FTE) up approximately 7% year over year, assuming the forward curve materializes and deposit and loan growth remains steady. The bank also targets approximately 200 basis points of operating leverage in 2026, reinforcing confidence in continued earnings expansion.
CEO Brian Moynihan reiterated optimism around U.S. economic growth in 2026, while CFO Alastair Borthwick emphasized disciplined expense management, strong liquidity, and healthy asset quality.
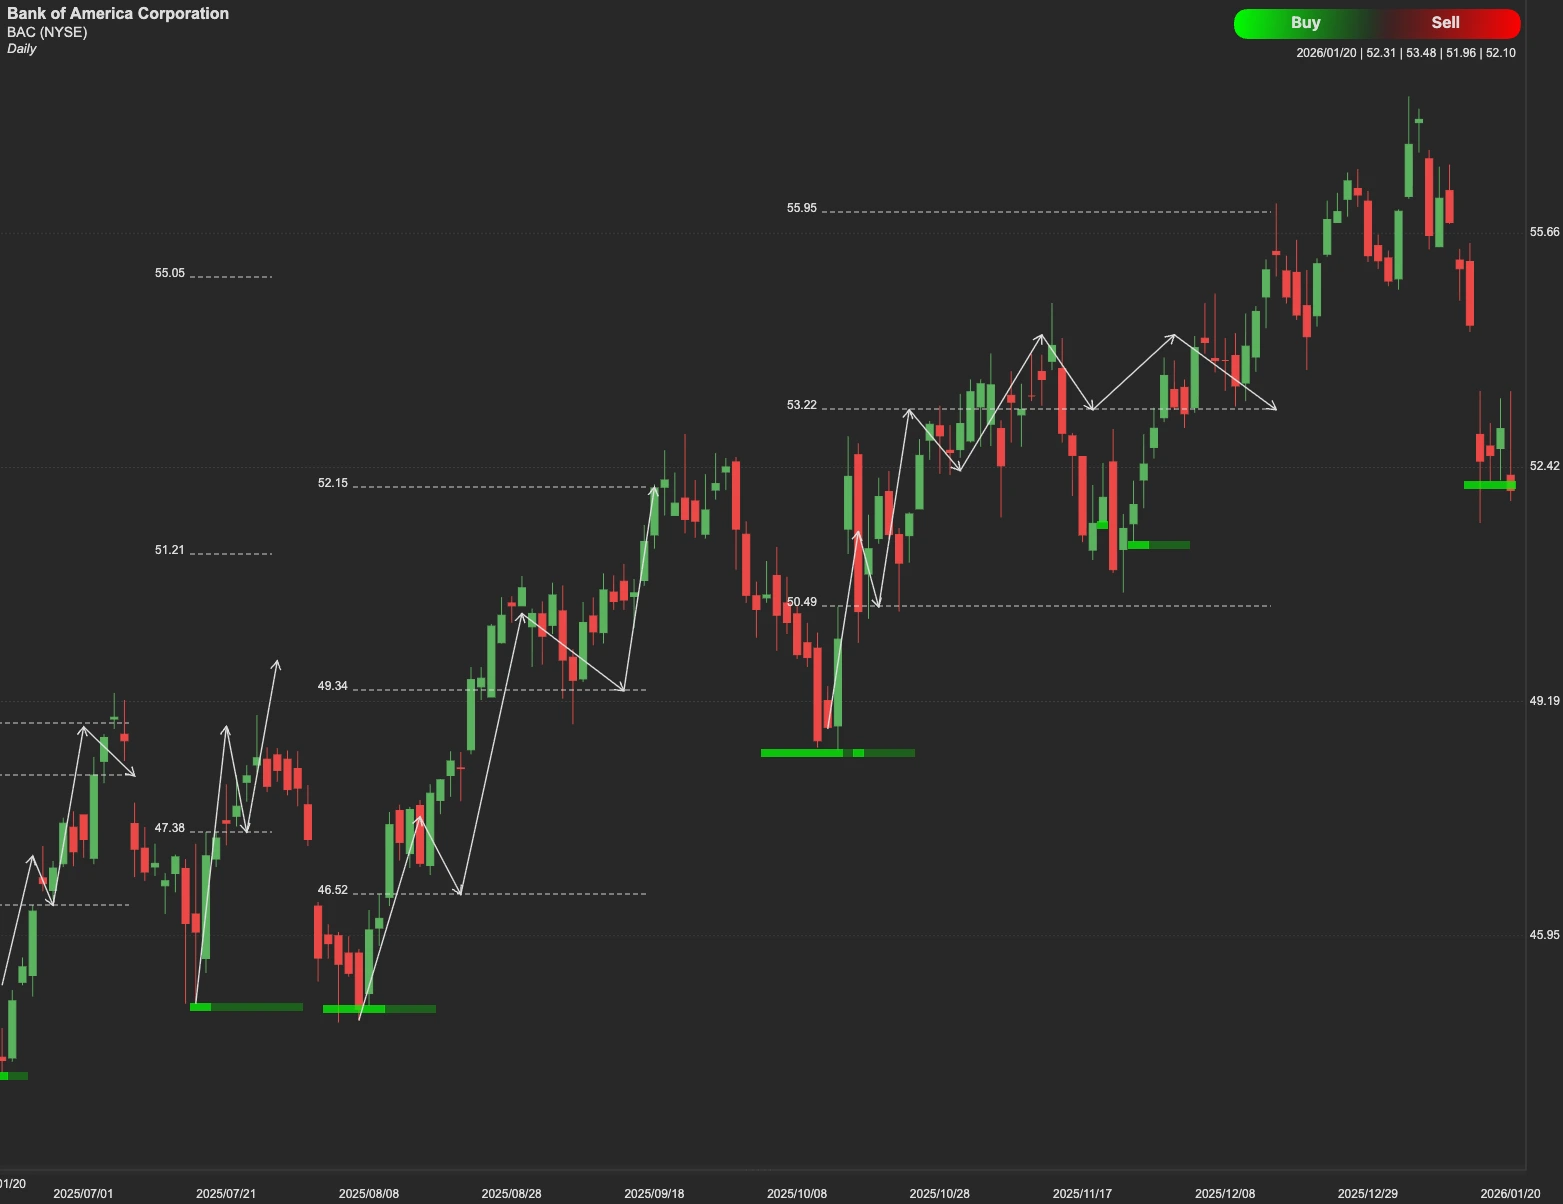
Technical Outlook
From a technical perspective, BAC is currently testing a major resistance level at $58. If the stock can consolidate and close decisively above this mark, the technical path clears for a run toward the $65 goal. This move would likely be supported by the company's 2026 guidance, which anticipates NII growth of 5% to 7% and continued operating leverage.
If $58 proves to be a formidable ceiling, a rejection could lead to a retracement. Investors should look for initial support at $45. In a broader market downturn or a "risk-off" environment, a deeper secondary support level exists at $35.