Conagra Brands: A Narrowed Path Forward Amid Inflationary Headwinds
Conagra Brands, Inc. (NYSE: CAG) released its third-quarter results for fiscal year 2026 on April 1, 2026, presenting a complex financial picture that combines organic growth with significant margin pressures. While the company returned to organic net sales growth, the stock faces a challenging technical environment that suggests a cautious approach for investors.
The Profitability Puzzle
For the quarter ended February 22, 2026, net sales declined 1.9% year over year to $2.8 billion, primarily due to the impact of divestitures. However, on an organic basis, revenue grew 2.4%, supported by a 1.9% price/mix increase and a modest 0.5% uptick in volume.
Gross profit fell 7.4% to $658 million, as higher organic net sales and productivity were more than offset by the negative impact of cost of goods sold inflation, unfavorable operating leverage, and lost profit from divested businesses. This resulted in a 141 basis point contraction in gross margin to 23.6%. SG&A expense fell 14.9% to $378 million in the quarter. As a result, operating profit increased 17% year over year to $280.1 million.
In the quarter, net income increased 37.7% to $200 million, and reported diluted EPS rose sharply to $0.42. In contrast, adjusted diluted EPS declined 23.5% year over year to $0.39. Adjusted EBITDA also dropped 14.9% to $437 million, reinforcing the margin compression narrative.
Segment performance was uneven. Grocery & Snacks segment saw a 6.3% decline in net sales due to divestitures, though organic growth remained positive, supported by pricing. Refrigerated & Frozen segment emerged as a relative bright spot, posting 1.6% net sales growth with volume recovery following prior supply constraints. International segment and Foodservice segment delivered modest net sales growth but faced declining profitability due to inflationary pressures and weaker volumes.
Debt Reduction and Weak Cash Flow Trends
CEO Sean Connolly noted that while the "macro backdrop remains dynamic," the company is over-delivering against the free cash flow conversion and debt reduction projections. Net debt was reduced by over $800 million year over year to $7.3 billion, bringing net leverage ratio down to 3.83x.
Operating cash flow generation, however, weakened significantly, declining 33.5% year to date to $896 million, driven primarily by lower operating profit and lapping the accelerated receipt of a portion of the company's outstanding receivables in the prior year. Capital expenditures were $314 million. These items resulted in free cash flow of $581 million, a decrease of $461 million compared to the prior year. Dividends paid were flat to prior year at $502 million. The company ended the quarter with cash and cash equivalents of $55.1 million.
Q3 FY26 Year To Date Performance
For the first three quarters of fiscal 2026, net sales decreased 4.9% to $8.4 billion. Gross profit decreased 13.2% to $2.0 billion in the first three quarters of fiscal 2026. Operating profit decreased 97.1% to $29.9 million, compared to $1,043.6 million in the first three quarters of fiscal 2025, primarily due to $771.3 million of Goodwill impairment charges and $197 million of other intangible asset impairment charges. As a result, net income was negative $299.3 million, compared to $896.5 million in the same period last year.
Guidance Narrowed
Management has narrowed its full-year 2026 guidance. The company now expects:
-
Organic Net Sales: Near the midpoint of a (1)% to 1% range.
-
Adjusted Operating Margin: Near the high end of the 11.0% to 11.5% range.
-
Adjusted EPS: Approximately $1.70, hitting the low end of its original forecast ($1.70 to $1.85 range).
-
Continued cost inflation—expected at around 7%—remains a key headwind.
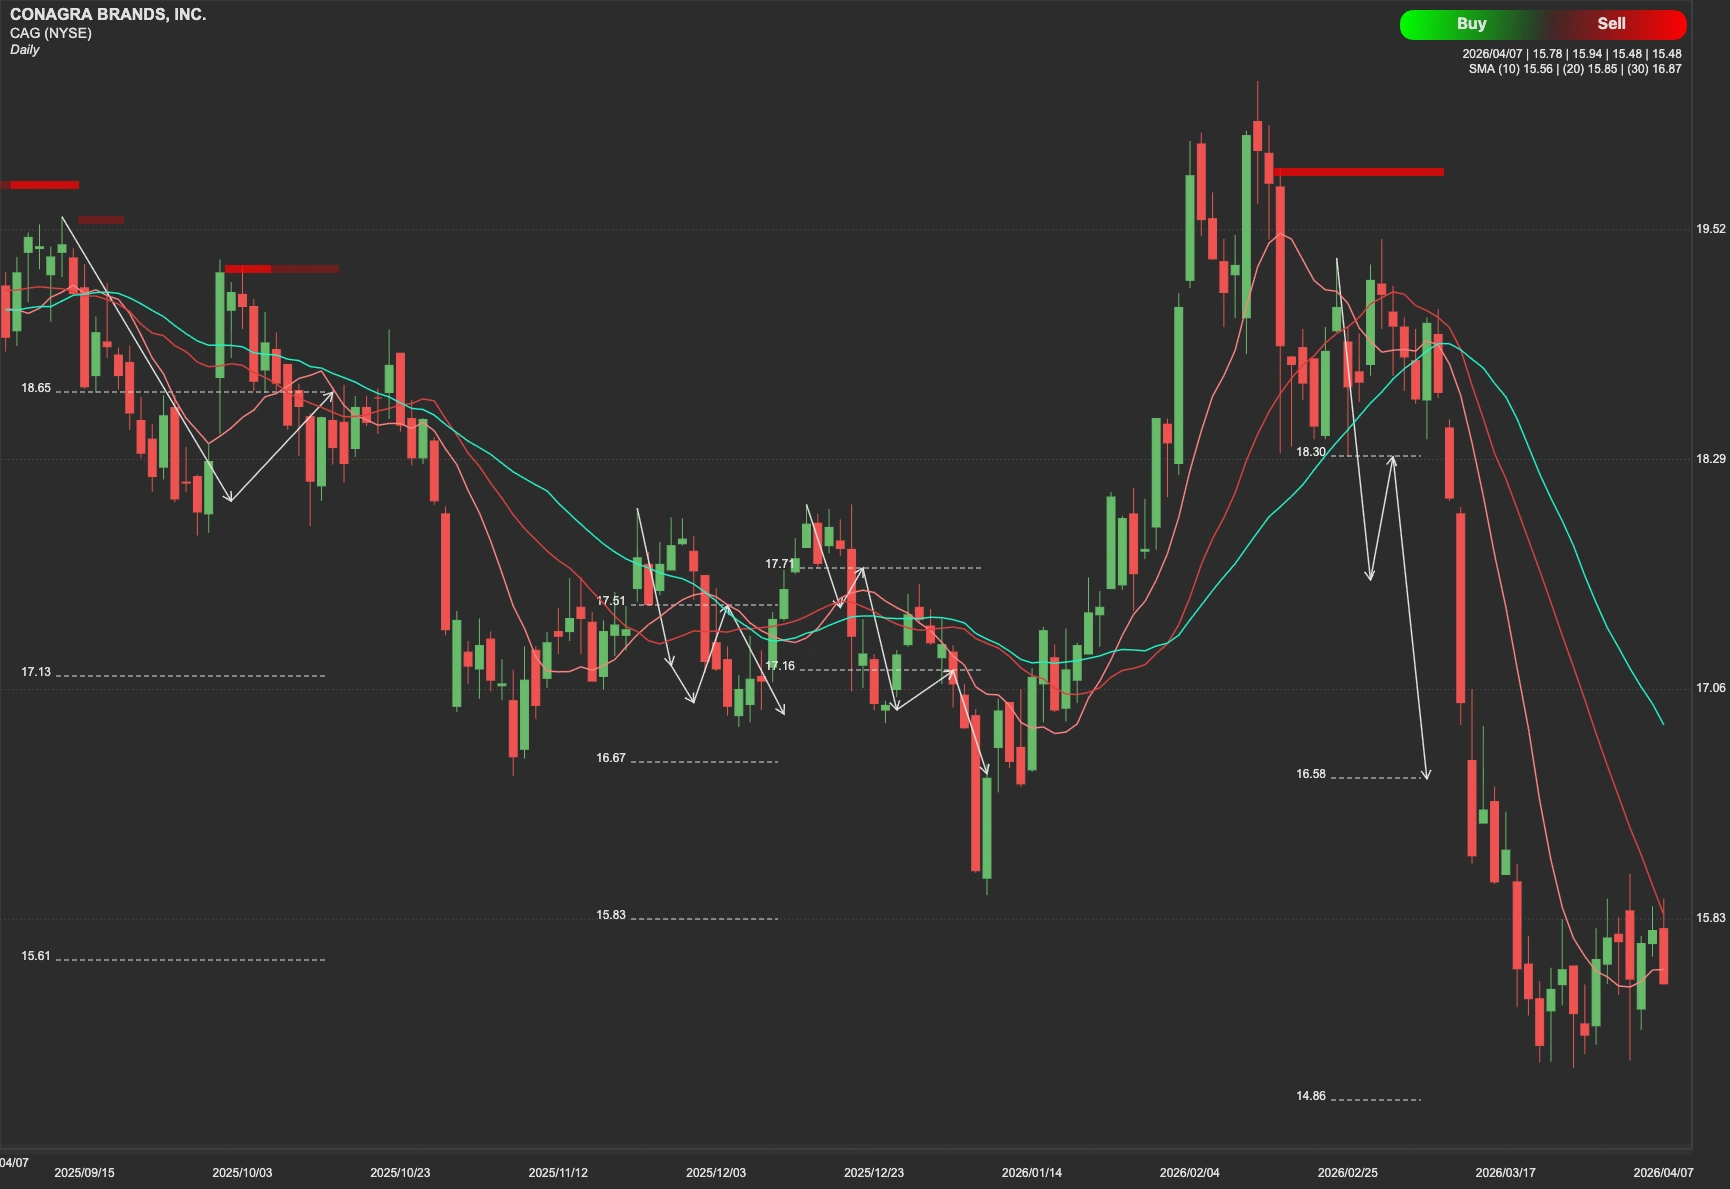
Market Outlook: The Long Road to Recovery
From a technical perspective, CAG stock remains in a structurally uncertain phase. In the short term, the $18 level represents a critical resistance threshold. A sustained move above this level could open the path toward the next resistance near $24. However, failure to break through resistance may result in renewed downside pressure, with potential support forming in the $12 to $8 range.
Over the longer term, a more meaningful trend reversal would require a break above the $31 resistance level, which currently defines the upper boundary of the broader trading range. Until such levels are convincingly breached, the stock lacks the confirmation needed to establish a durable uptrend.