General Mills Stock Analysis: Earnings Pressure Meets Technical Wall
General Mills, Inc. (NYSE: GIS) delivered a challenging set of fiscal 2026 second-quarter results, reflecting the near-term cost of strategic reinvestment, portfolio reshaping, and a still-cautious consumer environment. While management reaffirmed its full-year outlook, the numbers underline why the stock remains under pressure.
Fundamental Overview: The Cost of Transformation
For the quarter ended November 23, 2025, General Mills reported net sales of $4.9 billion, down 7% year over year, with a 6-point drag from divestitures and acquisitions, primarily tied to the North American yogurt exits. Organic net sales declined 1%, pressured by unfavorable price/mix despite improving volume trends.
Profitability took a sharper hit. Operating profit fell 32% to $728 million, while adjusted operating profit declined 20% in constant currency. Diluted EPS dropped 45% to $0.78, and adjusted EPS decreased 21% to $1.10, reflecting margin compression, restructuring costs, and weaker joint venture contributions.
Gross margin narrowed by 210 basis points to 34.8%, driven by higher input costs and unfavorable mark-to-market effects. Management emphasized that these declines were anticipated, given stepped-up investments aimed at rebuilding brand competitiveness and restoring volume growth.
Segment Performance: A Mixed Operating Picture
North America Retail, the company’s largest segment, saw net sales fall 13% to $2.9 billion, including a 10-point headwind from the North American Yogurt divestitures, with organic net sales down 3%. However, management pointed to improving pound growth and market share gains in most key categories, suggesting early traction from price and value adjustments.
North America Pet remained a relative bright spot, with net sales up 11% to $660 million, supported by the Whitebridge Pet Brands acquisition. Organic net sales were up 1 percent. Still, segment operating profit declined 12%, reflecting higher costs and marketing investments.
North America Foodservice posted an 8% sales decline to $582 million, largely due to yogurt divestitures, while International stood out positively. International net sales rose 6% to $729 million, and operating profit surged 30% in constant currency, led by strong performance in Brazil, China, India, and North Asia.
Cash Flow and Balance Sheet: Less Cushion, Still Stable
Operating cash flow for the first half of fiscal 2026 totaled $1.2 billion, down from $1.8 billion a year earlier, primarily due to lower net earnings. The company continued returning cash to shareholders, paying $659 million in dividends and repurchasing $500 million in shares during the first half.
Outlook: Reaffirmed, but with Limited Near-Term Upside
General Mills reaffirmed its fiscal 2026 guidance, expecting:
-
Organic net sales are expected to range between down 1 percent and up 1 percent.
-
Adjusted operating profit and adjusted diluted EPS are both expected to be down 10 to 15 percent in constant currency.
-
Free cash flow conversion is expected to be at least 95 percent of adjusted after-tax earnings.
-
The net impact of divestitures, acquisitions, foreign currency exchange, and the 53rd week is expected to reduce full-year net sales growth by approximately 4 percent.
Management remains focused on long-term brand health, innovation, and volume-led growth, but the near-term earnings trajectory remains under pressure from cost inflation, tariffs, and reinvestment spending.
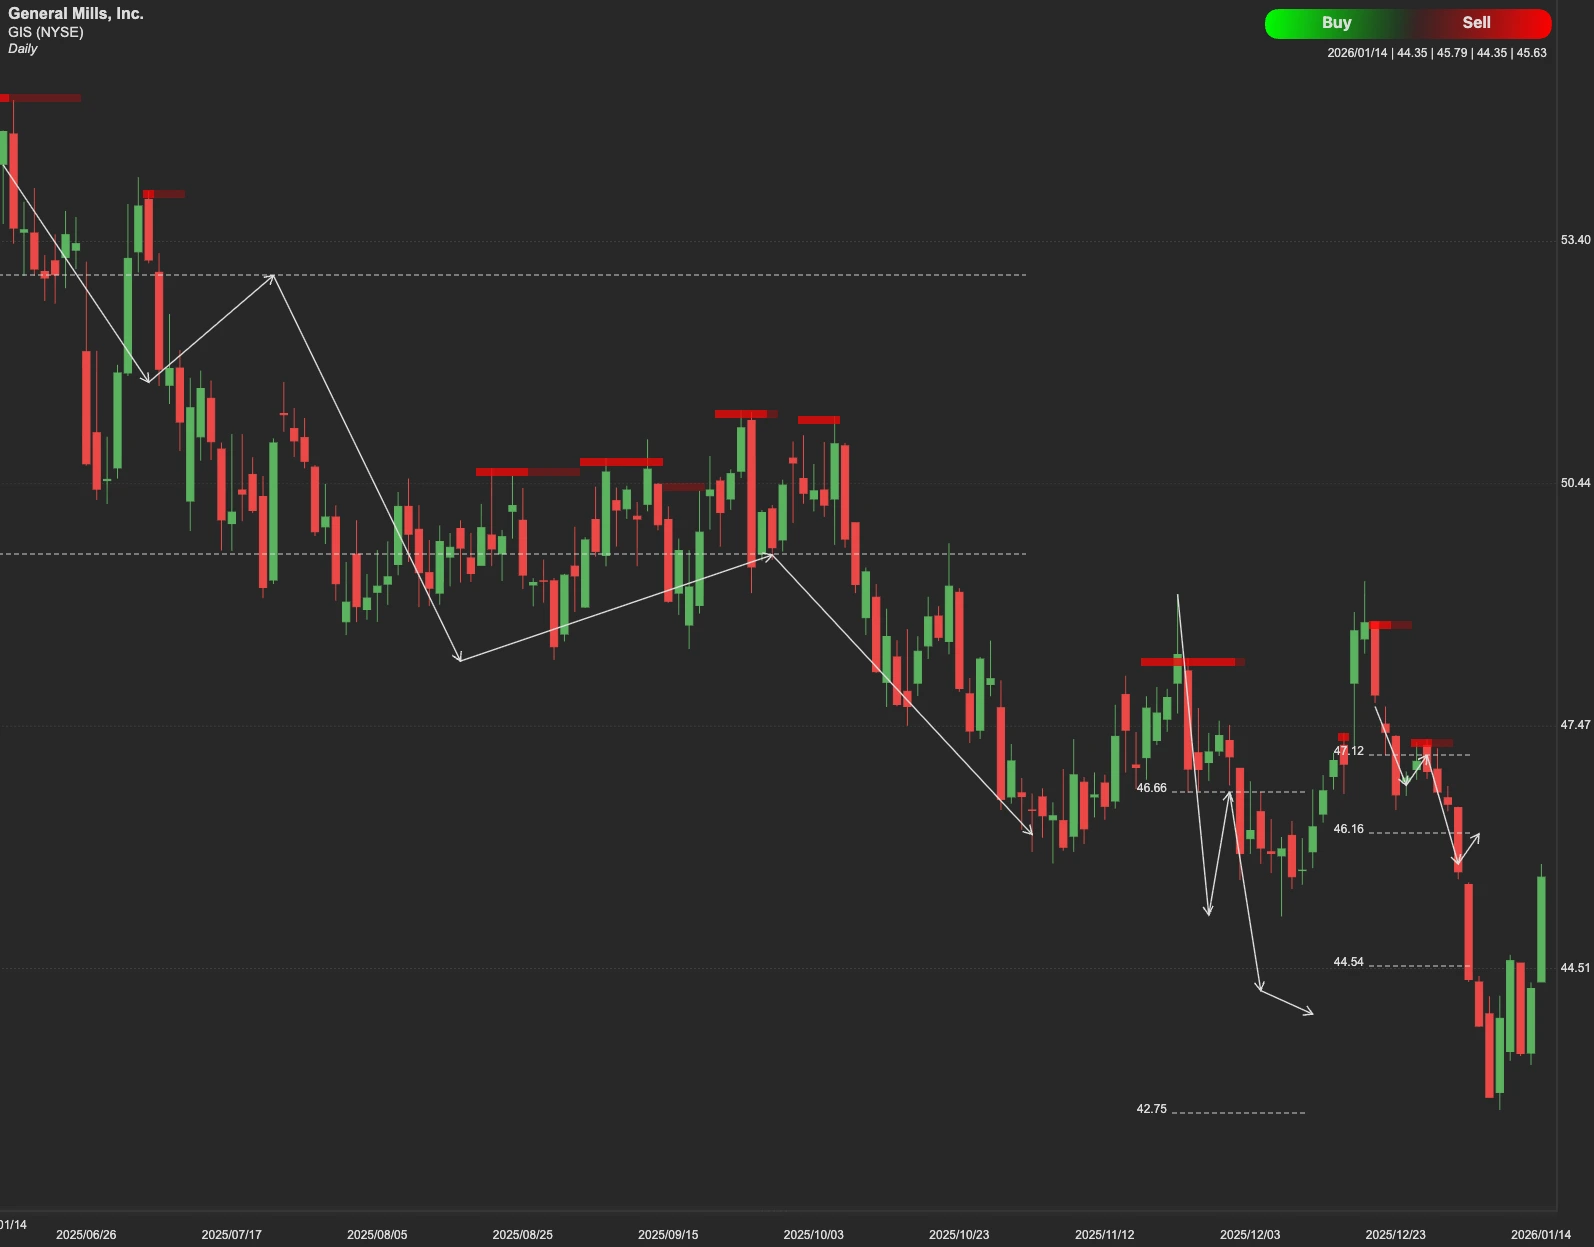
Technical Outlook
From a technical perspective, GIS stock has been characterized by a series of lower highs and lower lows, and the path to recovery is blocked by stiff technical barriers.
For the long term, the $63 level represents a significant and sustained resistance zone. Until GIS can clear this hurdle with conviction, any upward movement is likely to be viewed as a bounce rather than a true trend reversal.
In the short term, traders should keep a close eye on the $53 resistance level. If GIS can successfully break through $53, it could open a technical window to reach the $55–$60 range. Failure to hold or break above the resistance level could see the stock retreat to find its primary support at $40. If that floor fails to hold, further downside toward the deep support at $36 is a distinct possibility.