Lululemon Q1 FY26: Growth Continues Overseas, But Margin Pressure Remain Key Concerns
Shares of Lululemon Athletica Inc. (NASDAQ: LULU) remain under pressure following the company’s first-quarter fiscal 2026 earnings report, as slowing Americas demand, margin compression, and a lowered full-year outlook continue to weigh on investor sentiment. The athletic apparel company still demonstrates resilience through international expansion and strong balance sheet fundamentals.
A Solid Quarter Overshadowed by Weakening Momentum
Lululemon reported first-quarter fiscal 2026 total net revenue of $2.5 billion, up 4% year over year, or 2% on a constant dollar basis. Global comparable sales increased 1%, though they declined 2% when excluding currency impacts.
The most significant strength in the quarter was China Mainland, where revenue surged 30% and comparable sales increased 20%. The region now accounts for 19% of total company revenue, up from 16% a year ago. Growth in the Rest of World segment also remained healthy, with revenue increasing 13%.
However, these gains were partially offset by continued weakness in the Americas, Lululemon's largest market. Revenue in the region declined 3%, while comparable sales fell 5%. Americas revenue represented 66% of total revenue during the quarter, down from 71% in the prior year.
Margin Compression Raises Concerns
One of the most notable disappointments from the quarter was the sharp deterioration in profitability.
Gross profit was $1.3 billion, or 54.2% of net revenue, representing a steep drop of 410 basis points from the 58.3% in Q1 2025. This erosion was primarily driven by higher tariffs, increased markdowns, elevated inventory provisions, and rising occupancy and depreciation expenses.
Selling, General, and Administrative (SG&A) expenses climbed to 42.9% of net revenue, a 310 basis points deleverage. This was exacerbated by rising employee costs, brand activations, and expenses tied to a highly publicized proxy contest.
As a result, operating income plummeted by 37% to $276.9 million, causing the operating margin to contract by a massive 730 basis points to 11.2%. Diluted EPS landed at $1.69, marking a sharp drop from $2.60 per diluted share in Q1 2025.
Financial Position Remains Strong
Despite operational challenges, Lululemon’s balance sheet remains healthy.
The company ended the quarter with approximately $1.5 billion in cash and cash equivalents, while inventory levels remained well controlled. Inventories increased only 2% year over year to $1.7 billion and actually declined 4% on a unit basis.
Cash generation weakened but remained positive. Operating cash flow totaled $195.1 million during the quarter, while free cash flow reached approximately $67.7 million after capital expenditures of $127.4 million.
In addition, the company continued returning capital to shareholders, repurchasing 2.2 million shares for $358.3 million during the quarter.
Lowered Guidance
Management also acknowledged that the business experienced several unexpected headwinds toward the quarter. "More recently, we have been navigating headwinds that have led us to adjust our outlook for the full year," interim Co-CEO and CFO Meghan Frank stated. Frank added that "We have assessed the business and are taking additional actions to reposition where needed and further strengthen our product engine. We remain confident in our path forward."
Q2 2026 Outlook: Net revenue is projected to be between $2.450 billion and $2.475 billion (representing a 2% to 3% decline), with diluted EPS expected in the range of $1.76 to $1.81.
Full Year 2026 Outlook: Net revenue expectations have been tempered to a range of $11.000 billion to $11.150 billion (a decline of 0% to 1%). Full-year diluted EPS is guided at $10.95 to $11.15.
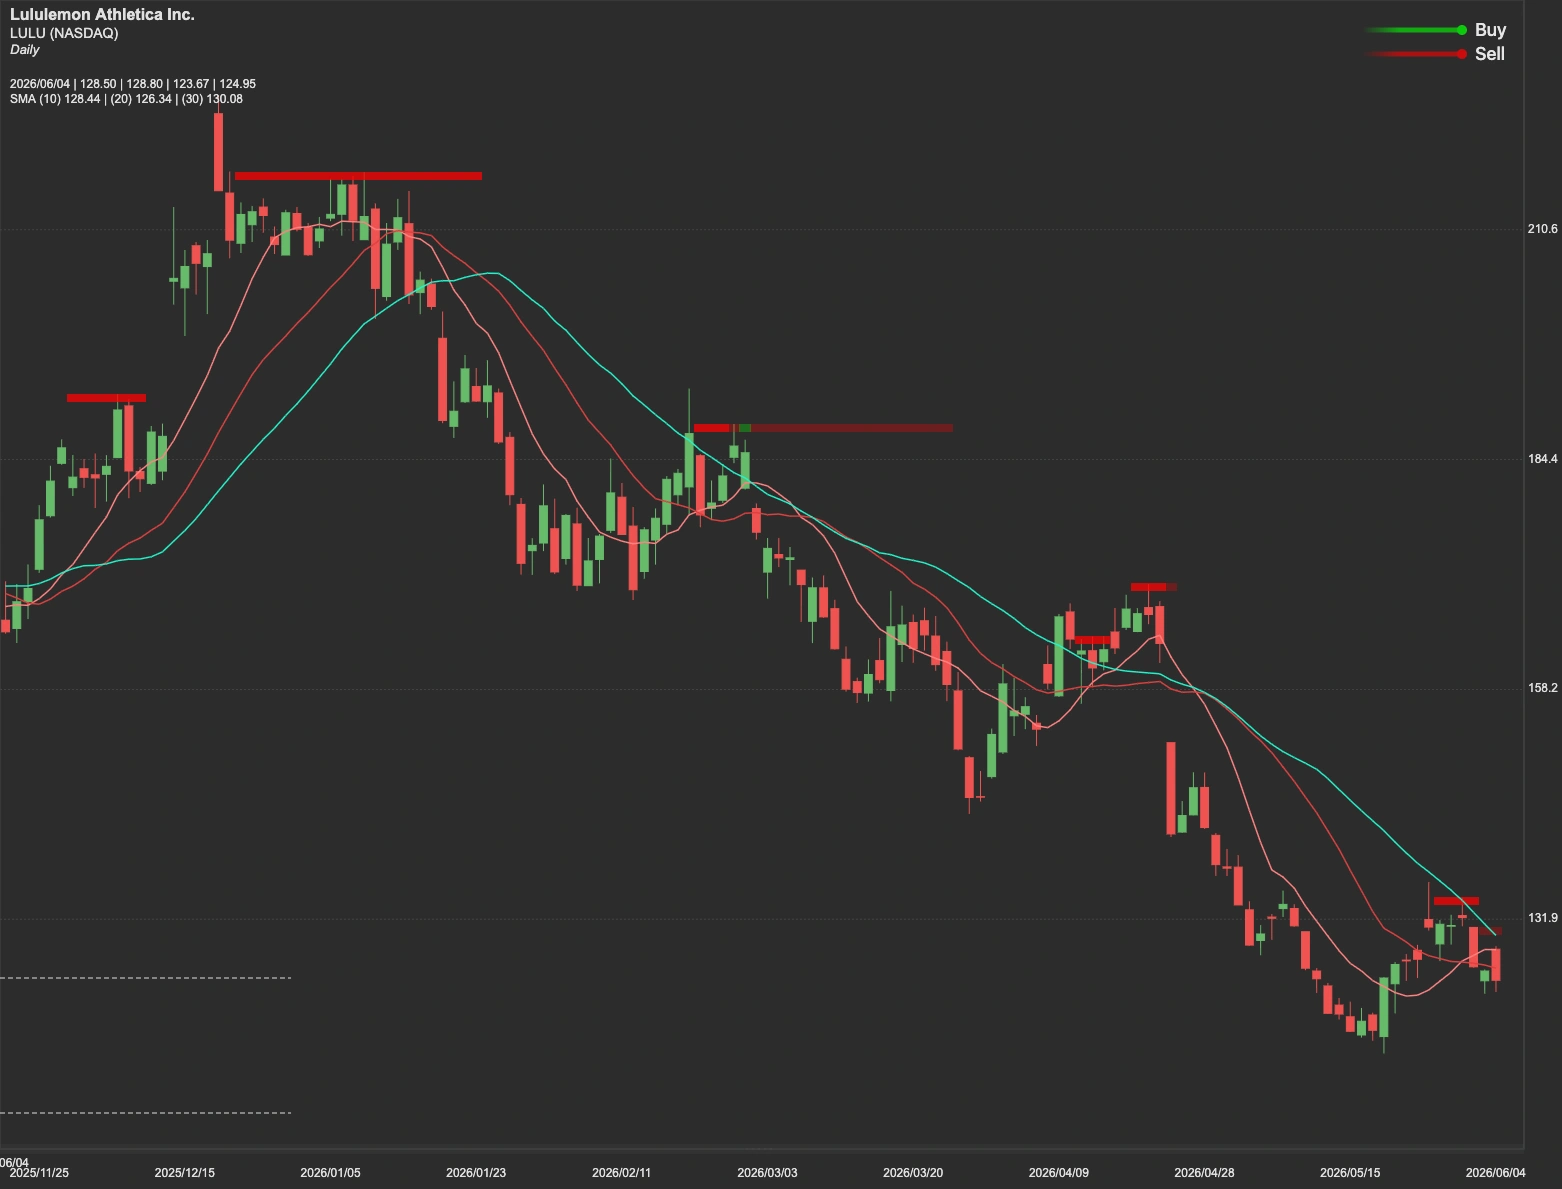
LULU Stock Technical Analysis
From a technical analysis perspective, LULU stock remains trapped within a challenging trading range and has yet to establish a convincing long-term reversal trend. As a result, a cautious approach remains warranted.
For short-term traders, the key resistance level sits at $163. A decisive breakout above this level would open the door toward the next major resistance zone near $200.
For medium-term investors, the next significant resistance remains around $247.
For long-term investors, the major resistance level remains near $269. Until the stock can successfully overcome these higher resistance zones, the broader technical structure remains uncertain.