lululemon Stock Analysis: Growth Slows as Margins Compress
Lululemon Athletica Inc. (NASDAQ:LULU) recently unveiled its fourth quarter and full-year fiscal 2025 results, painting a mixed picture. While the company managed to exceed its own conservative expectations, the underlying data reveals a company still growing globally but facing mounting pressure on profitability and its core North American market.
Slowing Growth Masks Regional Divergence
At first glance, the topline performance appears stable. For the fourth quarter, net revenue rose 1% year-over-year to $3.6 billion, effectively flat on a constant dollar basis. Excluding net revenue from the 53rd week of 2024, net revenue increased 6%, or 4% on a constant dollar basis. Comparable sales increased 3%. However, a deeper look reveals a clear split in performance.
International markets continue to be the primary growth engine. China Mainland posted standout momentum, with net revenue up 24% year-over-year in Q4 and comparable sales surging 30%. Overall international net revenue grew 17% year-over-year in the quarter, and comparable sales surged 20%.
In contrast, the Americas segment is losing steam. Q4 net revenue declined 4% year-over-year, and comparable sales slipped 1%, signaling weakening demand in the company’s largest market. This imbalance suggests that while global expansion is working, the core business is under pressure.
Margin Compression Becomes a Key Concern
While revenue held steady, profitability deteriorated meaningfully. Gross margin fell sharply by 550 basis points in Q4 to 54.9%, driven by higher tariffs, increased markdowns, and new credit card affiliate programs.
At the same time, SG&A deleveraged by 100 basis points, reflecting continued investment in brand building and fixed cost deleverage. As a result, operating income fell 22% to $812.3 million in the quarter, with operating margin compressing to 22.3% from 28.9% a year earlier. Earnings followed the same trend. Q4 diluted EPS fell to $5.01 from $6.14 a year earlier.
Balance Sheet and Capital Allocation
Balance sheet metrics remain solid, with $1.8 billion in cash and cash equivalents at the end of Q4 2025. However, inventory levels increased 18% to $1.7 billion at the end of Q4 2025 compared to $1.4 billion at the end of Q4 2024. The company repurchased 1.4 million of its shares for a cost of $269.1 million in the quarter.
Fiscal 2025 Performance Overview
For the full year, Lululemon reported a 5% increase in total net revenue, reaching $11.1 billion. Excluding net revenue from the 53rd week of 2024, net revenue increased 7%, or 6% on a constant dollar basis. Comparable sales increased 2%.
Profitability also took a hit. Gross profit was flat at $6.3 billion, and gross margin decreased 260 basis points to 56.6%. Income from operations decreased 12% to $2.2 billion, and operating margin decreased 380 basis points to 19.9%. Diluted earnings per share were $13.26 compared to $14.64 in 2024.
Strategic Priorities for 2026
Interim Co-CEO and CFO Meghan Frank highlighted that the "action plan" for 2026 focuses heavily on driving improvement in full-price sales, particularly in North America. The company is leaning on new product differentiation and "elevated guest experiences" to enhance brand health.
However, the outlook for fiscal 2026 remains modest. The company expects net revenue between $11.35 billion and $11.50 billion, representing growth of 2% to 4%, with diluted EPS guidance in the range of $12.10 to $12.30—implying another year of earnings contraction.
For Q1 fiscal 2026, the company expects revenue growth of 1% to 3%, with diluted EPS projected between $1.63 and $1.68, compared to $2.60 per diluted share in Q1 FY2025.
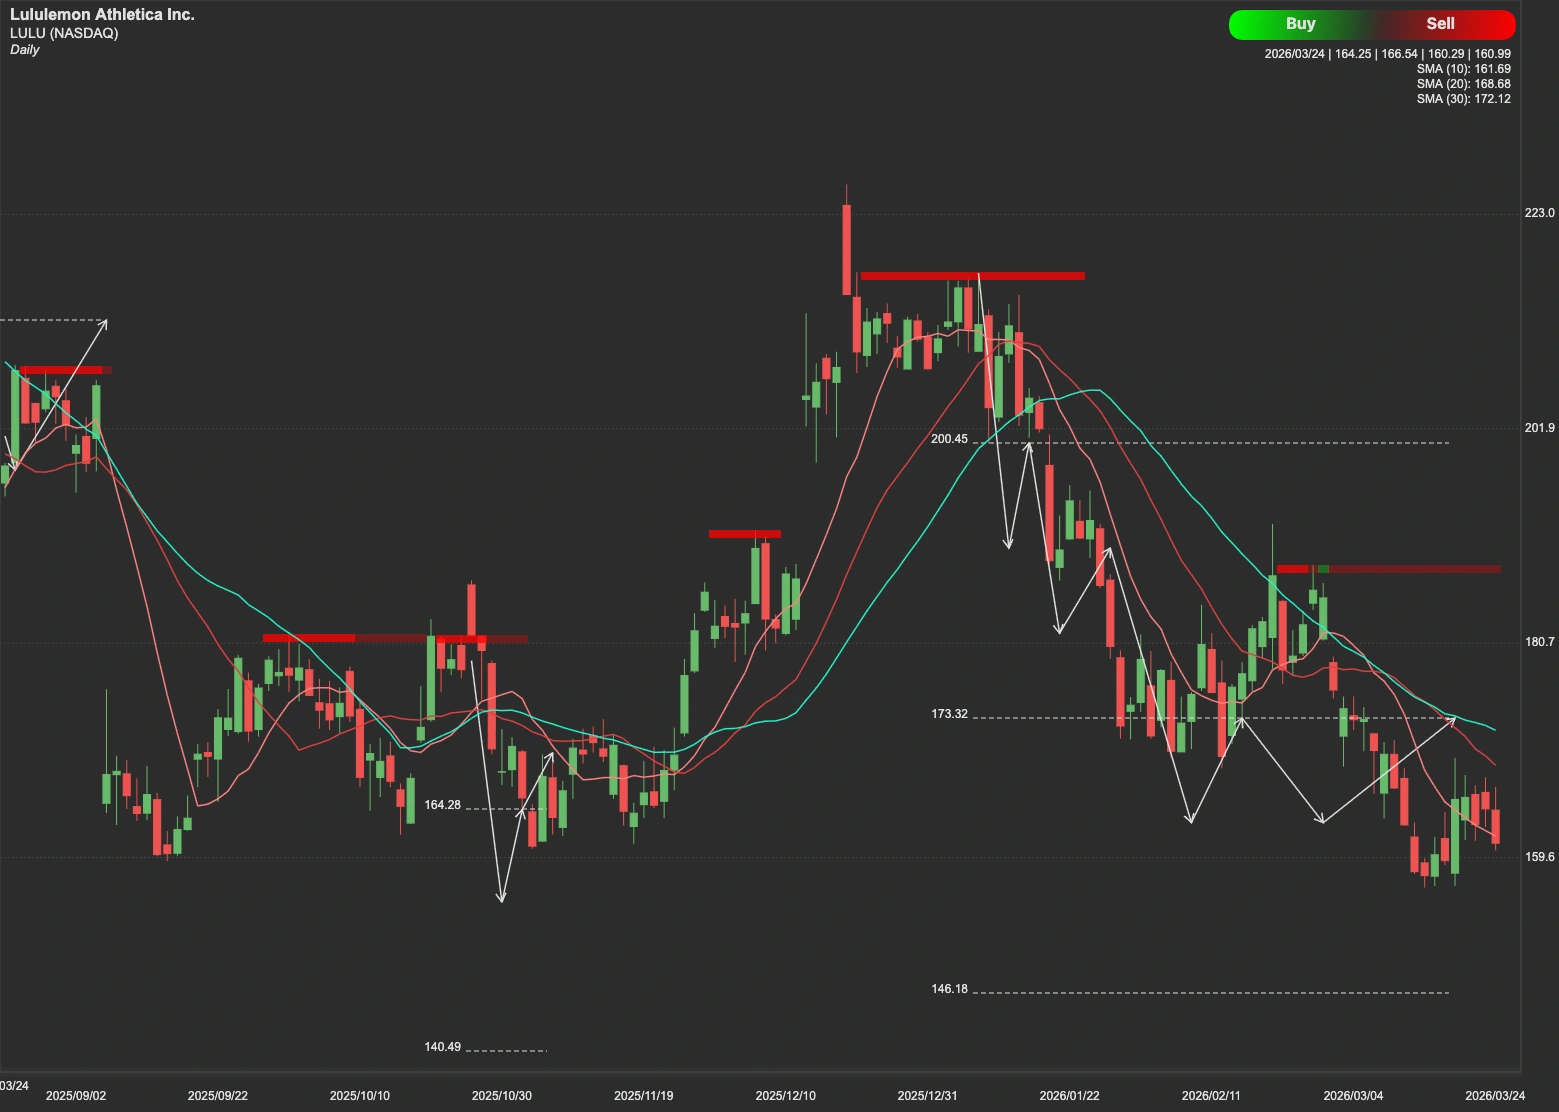
Technical Analysis: Why Caution is Warranted
From a technical perspective, LULU stock is currently trading within a difficult range and lacks clear upward momentum. The stock is currently battling to establish a firm floor, and several key hurdles remain.
The first major test for LULU is the $186 level. Until the stock can break and hold above this mark, the trend remains bearish. If it successfully clears $186, a much more formidable resistance awaits at $267.
On the downside, failure to overcome these resistance points may lead the stock to test support at $149. If that level does not hold, further downside could extend into the $117–$109 range.