Procter & Gamble Stock Analysis: Solid Cash Engine, Margins Under Pressure
The Procter & Gamble Company (NYSE:PG) reported fiscal year 2026 second-quarter results that underline the company’s resilience in a difficult consumer and geopolitical environment, while also highlighting near-term margin and earnings pressures driven by restructuring, tariffs, and reinvestment spending.
Revenue Holds Steady as Pricing Offsets Volume Declines
P&G reported net sales of $22.2 billion, representing a one percent increase year over year. However, organic sales—a key metric for underlying health—remained flat. The company faced significant headwinds from unit volume declines of one percent, which were offset by a one percent increase in pricing while mix remained neutral.
Regarding profitability, diluted GAAP earnings per share fell five percent year over year to $1.78, driven primarily by incremental restructuring charges. Core earnings per share remained steady at $1.88, matching the prior year's performance. Net earnings for the quarter totaled $4.3 billion, declining 7% year over year.
Margin Compression Intensifies from Tariffs and Reinvestment Spending
Margin pressure was evident throughout the quarter. Reported gross margin declined 120 basis points to 51.2%, while reported operating margin decreased 200 basis points to 24.2%, and core operating margin fell 70 basis points from the prior year. Selling, general and administrative expenses increased as the company stepped up reinvestment spending behind brands and innovation. Higher costs from tariffs alone accounted for roughly 60 basis points of margin impact, while unfavorable product mix and reinvestments further weighed on profitability.
Beauty and Health Care Drive Growth While Family Care Weakens
While total organic sales were flat, the performance varied significantly across P&G’s business units. The Beauty segment was a standout performer, with organic sales increasing four percent. Within this division, Hair Care grew mid-single digits due to innovation-driven pricing in Latin America and Europe, while Skin Care saw low single digits growth fueled by a favorable premium product mix and pricing in Greater China. Personal Care also contributed with mid-single digits growth driven by North American volume.
The Health Care segment followed with a three percent organic sales increase. Oral Care benefited from a premium product mix, while Personal Health Care grew low single digits on the back of higher pricing in North America. In contrast, the Fabric and Home Care segment saw flat organic sales. While Fabric Care volume gains in North America were offset by declines in Europe, the Home Care unit managed low single digits growth through North American pricing strategies.
The Grooming segment also reported flat organic sales as innovation-driven pricing in major markets was neutralized by volume declines. The most significant challenges appeared in the Baby, Feminine, and Family Care segment, where organic sales fell four percent. Baby and Feminine Care both saw low single digits declines due to volume decreases, while Family Care experienced a double digits drop, though management attributed this to a difficult comparison against exceptionally strong volume growth in the previous year.
Strong Cash Generation Supports Dividends and Buybacks
Despite weaker margins, Procter & Gamble continued to demonstrate strong cash generation. Operating cash flow reached $5.0 billion for the quarter, while adjusted free cash flow totaled $3.8 billion, translating into adjusted free cash flow productivity of 88%. The company returned $4.8 billion to shareholders through dividends and share repurchases, reinforcing its position as a reliable income and capital-return stock within the consumer staples sector.
Full-Year Guidance Maintained Despite Rising Cost Headwinds
Management maintained its fiscal 2026 organic sales growth outlook of flat to up 4% and reaffirmed core earnings per share growth in the same range, implying a midpoint core EPS of roughly $6.96. However, GAAP EPS growth guidance was lowered to between 1% and 6% as restructuring costs increased. Commodity costs are now expected to be neutral for the year, while foreign exchange is forecast to provide a $200 million tailwind after tax. These positives are more than offset by approximately $400 million in higher tariff-related costs and an estimated $250 million combined headwind from higher interest expense and tax rates, resulting in a net earnings drag of about $0.19 per share for fiscal 2026.
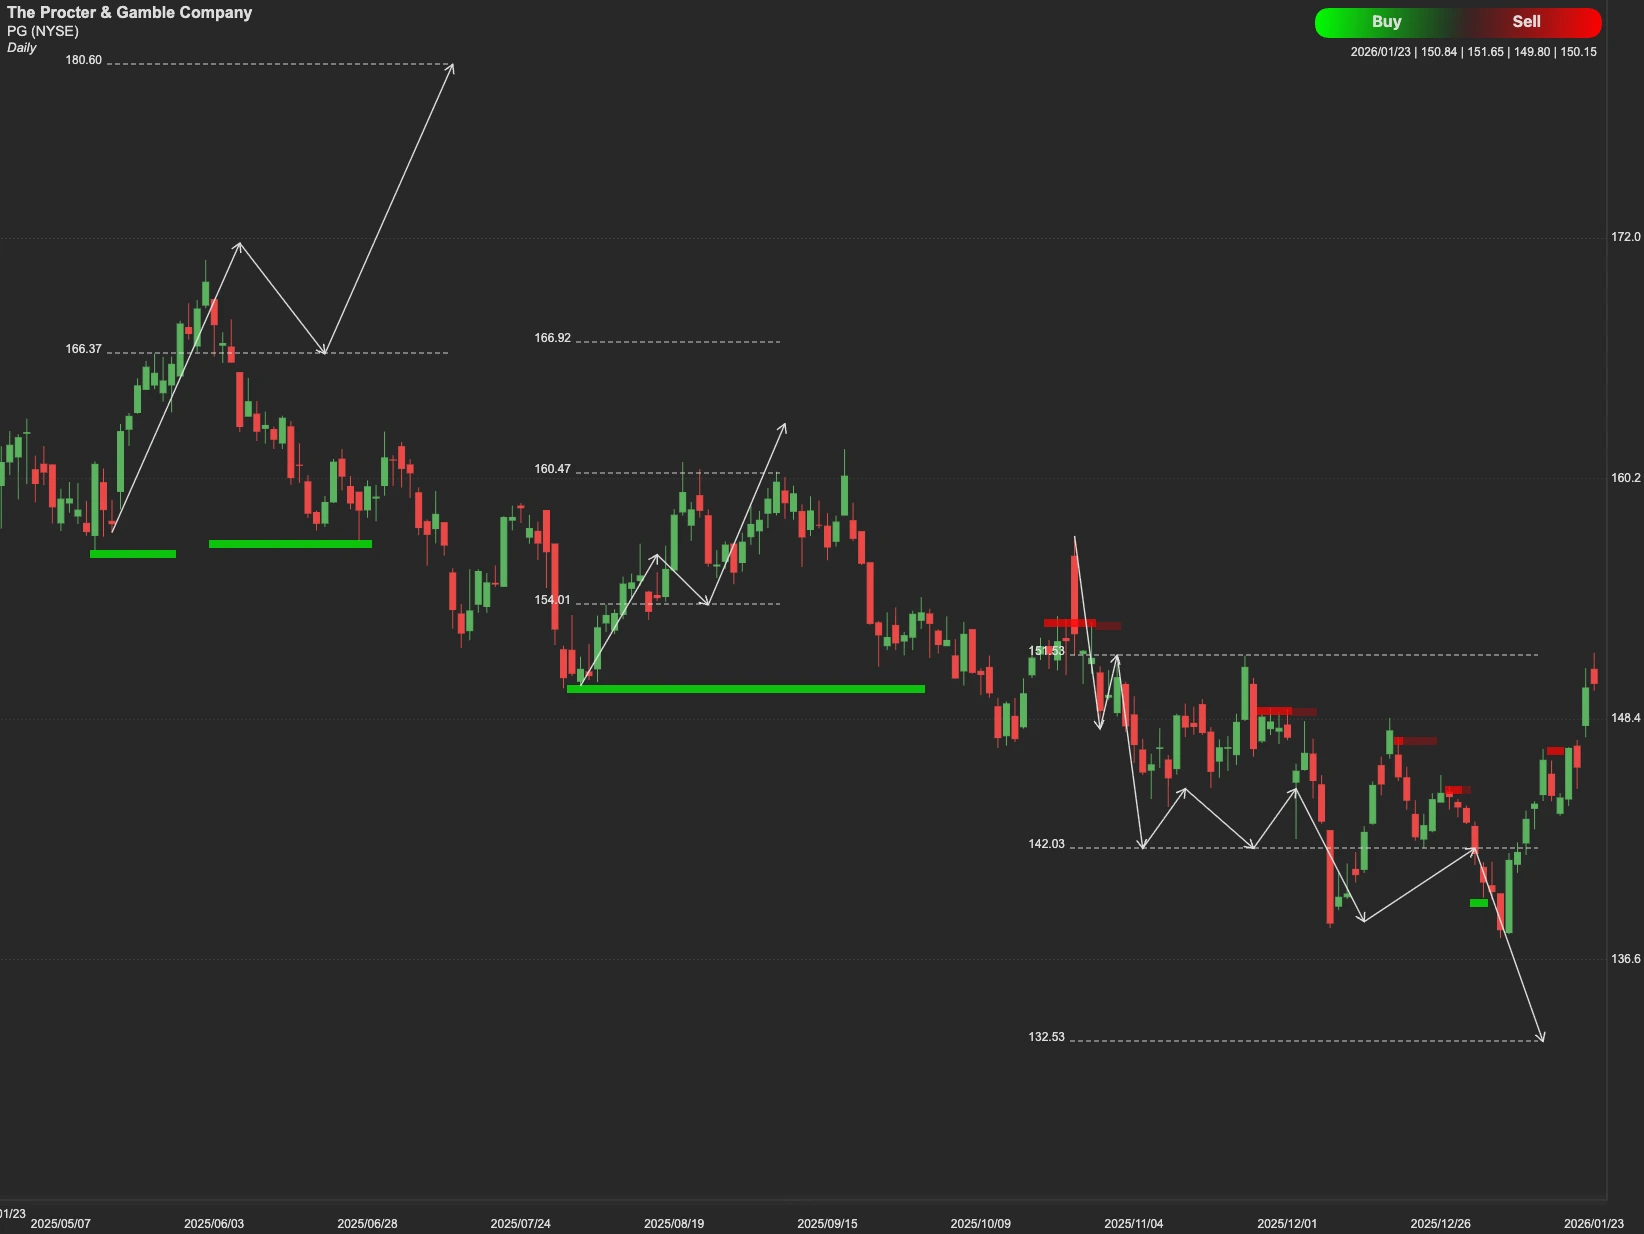
PG Stock Technical View
From a technical perspective, PG is currently testing a crucial pivot point at the $165 resistance level. This serves as the immediate ceiling for the stock. If the price can break and consolidate above $165, it clears the path for a momentum-driven rally toward the next goal of $180.
Conversely, failure to overcome this resistance could see the stock retreat to find stability at lower levels. The first major support zone sits at $134, with further downside risk extending toward the $125 area if selling pressure accelerates.