
SoFi Stock Analysis: Record Q2 2026 Financials Meet Post-Earnings Technical Resistance
SoFi Technologies, Inc. (NASDAQ: SOFI) delivered another record quarter, with strong revenue growth, record loan originations, rapid member expansion and improving profitability. However, the stock fell 8.9% following the earnings release, highlighting investor concerns despite the company's strong underlying operating performance.
Strong Q2 2026 Results
SoFi reported record GAAP net revenue of $1.22 billion for the second quarter of 2026, up 43% year over year. Adjusted net revenue reached approximately $1.2 billion, increasing 40% from the same period last year.
Adjusted EBITDA rose 44% year over year to a record $357.8 million, producing a strong 30% adjusted EBITDA margin. GAAP net income reached $156.6 million, compared with $97.3 million in the prior-year quarter, while diluted earnings per share increased to $0.12 from $0.08.
SoFi's strong revenue growth translated into higher profitability, but operating expenses also increased significantly. Total noninterest expenses reached approximately $1.0 billion, up $267.9 million year over year. Sales and marketing expenses rose 48% to $392.4 million, while technology and product development costs increased to $191.3 million. The increase in expenses reflects continued investment in customer acquisition, technology, product development and brand building.
During the quarter, average total deposits comprised over 90% of average total liabilities. The average rate paid on deposits in the second quarter was 156 basis points lower than that paid on warehouse facilities, which translates to approximately $712.6 million of annualized interest expense savings due to the successful remixing of the funding base.
Record Members and Products Strengthen the Everything-App Strategy
SoFi's member base increased 35% year over year to a record 15.8 million. The company added 1.1 million members during the quarter, marking another strong period of customer acquisition.
Even more notable was product growth. Total products increased 42% year over year to approximately 24.4 million after SoFi added a record 2.2 million products during the quarter.
Products per member reached an all-time high of 1.54, demonstrating that existing customers are increasingly using multiple SoFi services.
Cross-buy activity also accelerated. Existing members accounted for 51% of new products opened during the quarter, compared with 43% in the previous quarter and 35% in the second quarter of 2025.
Lending Business Remains the Growth Engine
Lending Segment GAAP net revenue jumped 63% year over year to $724.8 million. Lending segment performance was driven by net interest income, which rose 54% year over year. The balance of the growth was primarily driven from loan origination fees which increased 64% from the prior year.
Total loan originations reached a record $14.8 billion in the second quarter, increasing 69% from the prior-year period. Personal loan originations reached $10.7 billion, up 54% year over year, inclusive of $3.1 billion originated on behalf of third parties through our Loan Platform Business, while student loan originations surged 170% to $2.7 billion. Home loan volume increased 74% to $1.4 billion.
This diversified lending model is important because it gives SoFi multiple ways to generate revenue. The company can earn net interest income from loans held on its balance sheet while also generating fee-based revenue through loans originated or referred through its platform.
Credit quality also remained solid. Management reported improving charge-off trends, with estimated all-in annualised net charge-offs for personal loans improving to approximately 3.7%, while maintaining confidence that lifetime losses remain comfortably below the company's 7%–8% underwriting tolerance.
Financial Services Business Continues to Expand
The Financial Services segment generated $466.3 million in net revenue, up 29% year over year. This segment provides the low-cost funding (deposits) that powers the lending engine. Total deposits reached $45.5 billion, growing $5.3 billion in the quarter alone.
Noninterest Income Growth: Interchange fee revenue increased 55% year over year, as a result of $28 billion in total annualized spend in the quarter across SoFi Money and Credit Card, while brokerage fee revenue rose nearly 2.5 times from the prior-year period.
Loan Platform Business (LPB): LPB generated $143.3 million in consolidated adjusted net revenue by originating $3.1 billion in personal loans for third-party partners.
Financial Services products increased 43% to 21.3 million, with SoFi Money, Relay and Invest contributing significantly to growth. SoFi Money reached 7.9 million products, Relay reached 8.0 million, and SoFi Invest reached 3.9 million products.
Technology Platform Faces Headwinds but Stabilises
The Technology Platform remains the weakest business segment. Net revenue declined 23% year-over-year to $84.5 million due to the loss of a major client that exited the platform in late 2025.
However, there were encouraging signs:
- Enabled accounts increased by 2 million sequentially.
- SoFi launched its unified SoFi Tech Solutions brand.
- New enterprise capabilities were introduced across payments, lending, fraud prevention and core banking infrastructure.
Revised 2026 Guidance
Management raised its full-year revenue outlook, now expecting adjusted net revenue between $4.75 billion and $4.85 billion, representing annual growth of approximately 32% to 35%.
SoFi continues to expect approximately $1.6 billion of adjusted EBITDA, implying an adjusted EBITDA margin of around 33% to 34%. Adjusted net income is continued to be expected to reach approximately $825 million, while adjusted EPS is projected at approximately $0.60 per share.
SOFI Stock Technical Analysis
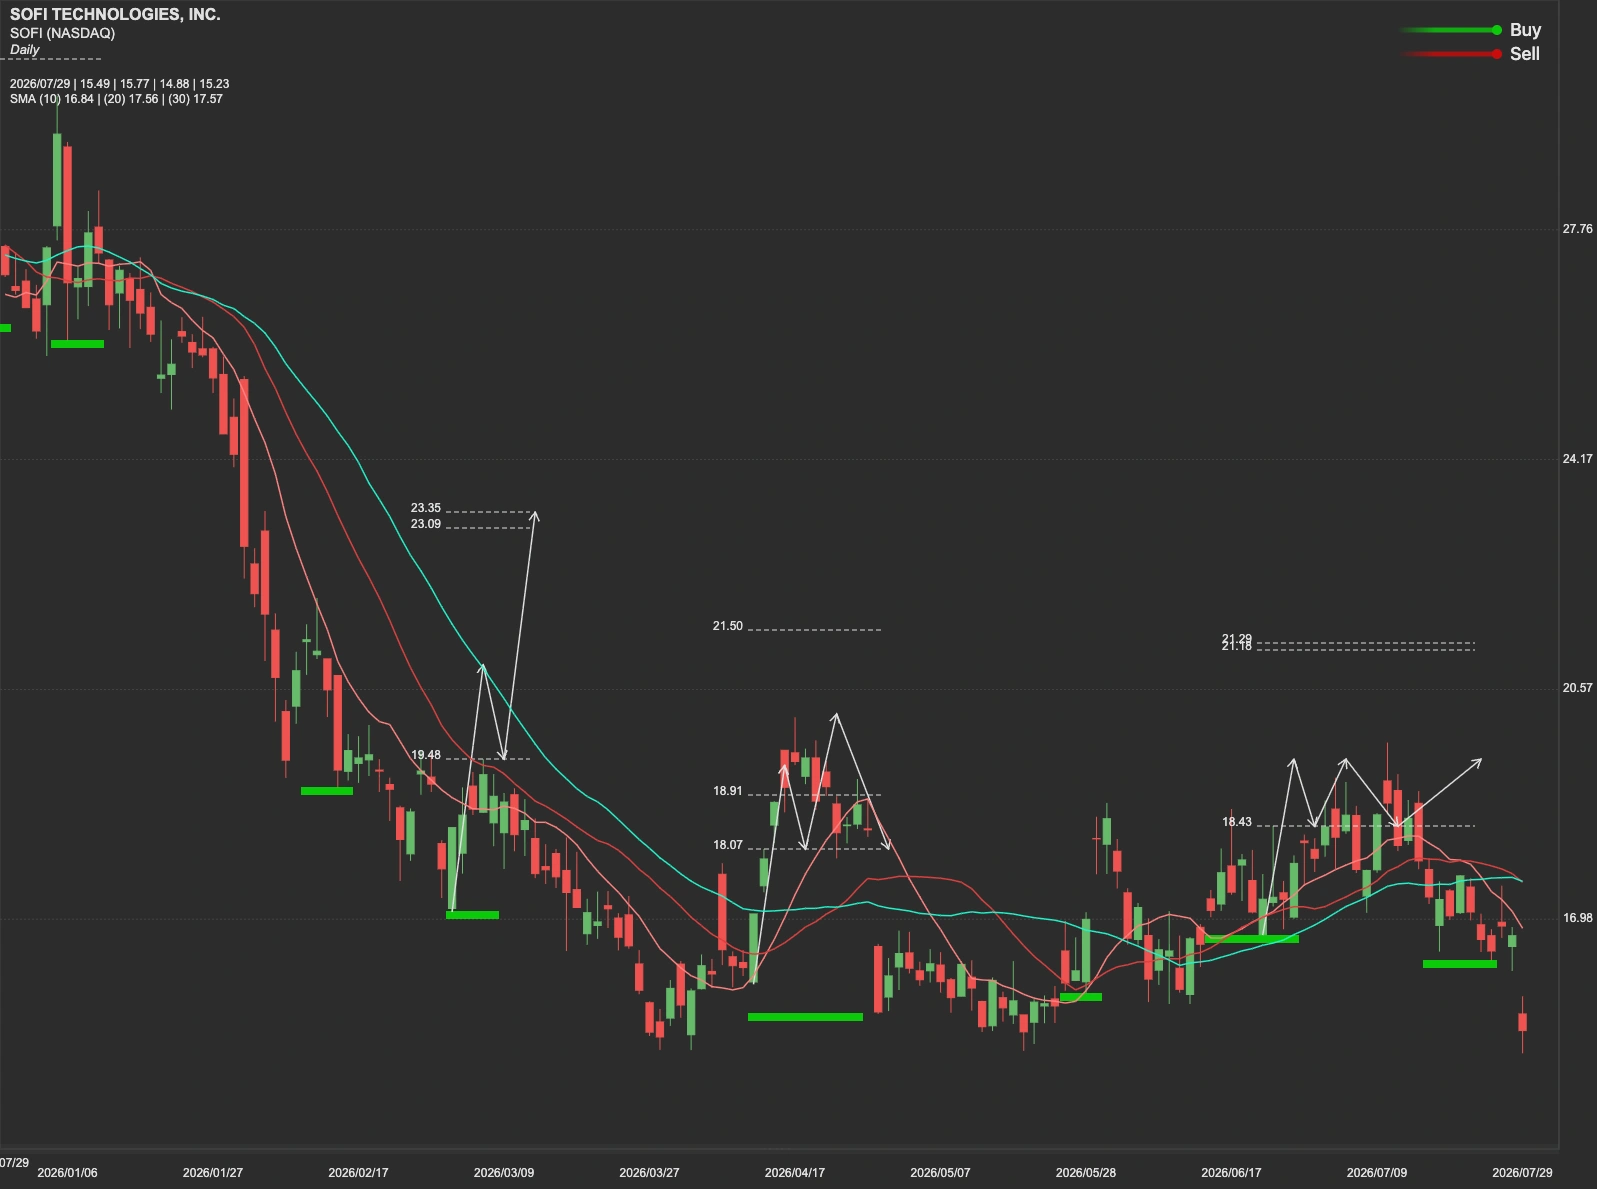
Despite the strong earnings report and upgraded revenue guidance, SOFI shares dropped 8.9% following the earnings release. With SOFI now facing a key resistance level at $17, the stock's ability to reclaim and hold above this level could determine whether the recent weakness develops into a recovery. A sustained move above $17 would put the next major resistance level near $22 into focus. Until these resistance levels are overcome, investors should remain cautious about confirming a sustained upward trend.