The Home Depot Stock Analysis: Stable Core Demand and Margin Pressure
The Home Depot, Inc. (NYSE: HD) closed fiscal 2025 with mixed results, reflecting both structural resilience and cyclical headwinds in housing and consumer spending.
Q4: Sales Impacted by Calendar Shift, Margins Compressed
Fourth-quarter fiscal 2025 sales declined 3.8% year over year to $38.2 billion. The comparison was distorted by a 53-week fiscal 2024, as the prior-year fourth quarter included a 14th week that contributed approximately $2.5 billion in sales and roughly $0.30 in diluted EPS.
On a comparable basis, performance was steadier. Comparable sales for the fourth quarter increased 0.4%, with U.S. comps up 0.3%, compared with 0.8% in comparable sales growth in Q4 last year, indicating relatively flat but resilient consumer demand.
Profitability metrics softened. Gross margin contracted 20 basis points to 32.6%, while operating margin declined to 10.1% from 11.3% a year ago. Operating income fell 14.4% to $3.8 billion. Net earnings were $2.6 billion, or $2.58 per diluted share, compared with net earnings of $3.0 billion, or $3.02 per diluted share, in the same period of fiscal 2024. Adjusted diluted EPS came in at $2.72 versus $3.13 in the prior-year period, again influenced by the extra week in fiscal 2024.
Fiscal 2025: Modest Top-Line Growth
For the full fiscal year 2025, revenue increased 3.2% to $164.7 billion. Comparable sales rose 0.3% overall and 0.5% in the U.S., showing modest but positive momentum. Gross profit was $54.9 billion, up 2.9% from $53.3 billion in fiscal 2024. Gross margin was 33.3%, compared with 33.4% in fiscal 2024. Despite the revenue growth, operating income declined 3.0% to $20.9 billion, and operating margin narrowed to 12.7% from 13.5%.
Net earnings totaled $14.2 billion, down 4.4% year over year, with diluted EPS of $14.23, down 4.6% year over year. Adjusted diluted EPS was $14.69 compared to $15.24 in fiscal 2024.
Management noted that storm-related demand variability and ongoing housing uncertainty influenced results, though underlying demand trends remained steady throughout the year.
Dividend and Shareholder Returns
Home Depot continues to reward shareholders with consistent capital returns. The board approved a 1.3% increase in the quarterly dividend to $2.33 per share, bringing the annual dividend to $9.32 per share. This marks the company’s 156th consecutive quarterly dividend payment, reinforcing management’s long-term capital return discipline.
Fiscal 2026 Guidance: Conservative But Stable
Looking ahead, management projects fiscal 2026 total sales growth of approximately 2.5% to 4.5%, with comparable sales ranging from flat to up 2%. Operating margin is expected to land between 12.4% and 12.6%, slightly below fiscal 2025’s 12.7%. Adjusted operating margin is guided to 12.8% to 13.0%.
Diluted EPS is expected to grow flat to 4% from fiscal 2025’s $14.23, with adjusted EPS growth also in the flat to 4% range from $14.69 in fiscal 2025. Capital expenditures are projected at about 2.5% of sales. Net interest expense is expected to be approximately $2.3 billion. Overall, guidance suggests stabilization rather than acceleration.
With over 2,359 retail stores and more than 1,250 SRS locations across all 50 states, the District of Columbia, Puerto Rico, the U.S. Virgin Islands, Guam, 10 Canadian provinces and Mexico, Home Depot continues to leverage scale, professional customer penetration, and supply chain integration to protect market share.
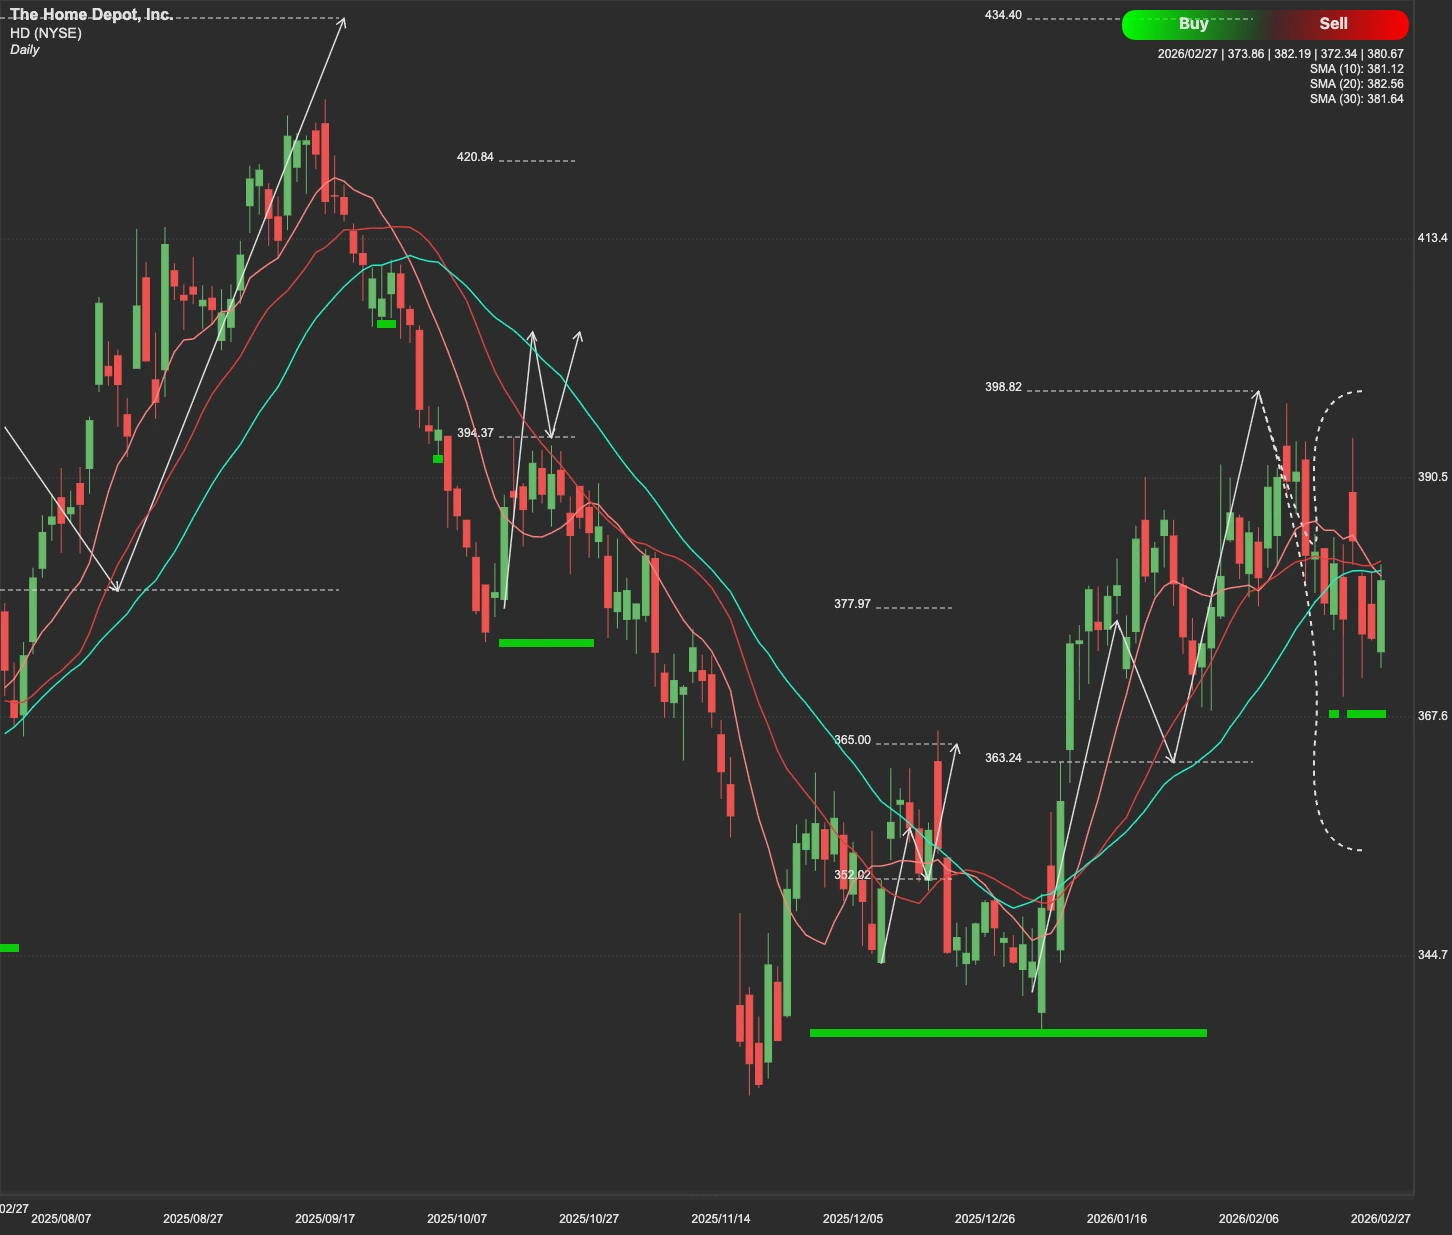
Technical Analysis
From a technical perspective, HD stock is currently trading within a well-defined range, with several critical levels shaping the near-term outlook.
The immediate resistance sits at $403. This level represents a key breakout zone. If HD decisively holds above $403 with strong volume confirmation, the next upside target is $429, which marks the next major resistance area and potential prior swing high region.
On the downside, failure to break above $403 increases the probability of a pullback. The first support lies near $359. If selling pressure intensifies and $359 fails to hold, the next major support is around $330-$316, which represents a deeper structural support zone and longer-term demand area.