
Citigroup Q2 2026 Analysis: Decades-Best Earnings and $30 billion buyback
Citigroup Inc. (NYSE: C) delivered one of its strongest quarters in recent history as the banking giant reported its highest quarterly revenue in a decade and continued to demonstrate the benefits of its diversified global banking model.
Strong Revenue Growth and Improving Profitability
Citigroup reported second-quarter 2026 revenue of $24.8 billion, an increase of 14% from $21.7 billion a year earlier. Net interest income increased 13% year over year. Non-interest revenue climbed 18%.
Operating expenses increased 5% to $14.2 billion, primarily due to higher compensation expenses, transactional servicing costs and deposit insurance expenses. Despite the increase in spending, Citigroup improved its efficiency ratio to 57.4%, representing a 530 basis point improvement from the prior year and indicating positive operating leverage as revenue growth outpaced expense growth.
Net income surged 45% to $5.8 billion, while diluted earnings per share jumped to $3.15 from $1.96 in the prior-year quarter. The strong earnings growth was supported by higher revenues, a lower provision for credit losses, and the continued impact of share repurchases that reduced the company's share count.
Services and Markets Continue to Lead
Services once again remained Citi's largest earnings engine. Revenue increased 18% to $6.4 billion, supported by continued expansion in Treasury & Trade Solutions and Securities Services. Net interest income increased 18%, primarily driven by an increase in average deposit balances. Non-interest revenue increased 16%, primarily driven by continued momentum in fees and underlying drivers across the business, particularly cross-border transaction value and assets under custody and administration.
Markets also produced another impressive quarter. Revenue rose 17% to $7.0 billion, with Equity Markets delivering exceptional 45% growth. Fixed Income Markets also posted healthy gains thanks to stronger performance across both financing and credit trading in spread products, as well as growth in commodities.
Credit Quality and Capital Remain Healthy
Provision for credit losses declined to $2.5 billion from $2.9 billion in the prior-year quarter despite continued loan growth. Net credit losses increased 8% to $2.4 billion, largely driven by Banking and Legacy Franchises, while the net allowance for credit losses build was limited to only $118 million compared with $638 million in the previous year.
Profitability metrics also improved considerably. Return on average common equity increased to 11.4%, up 370 basis points year over year, while return on average tangible common equity rose to 13.0%, up 430 basis points.
Citigroup's balance sheet remained strong and continued to expand. End-of-period loans increased 9% year over year to $794 billion, while average loans rose 10% to $785 billion, driven primarily by growth in Markets, Wealth, Services and U.S. Consumer Cards. Deposits also showed strong momentum, with both average and ending deposits reaching approximately $1.5 trillion, up 12% and 10%, respectively.
Capital levels remained comfortably above regulatory requirements. Citigroup ended the quarter with a preliminary CET1 capital ratio of 12.8%, slightly above the previous quarter's 12.7%, supported by strong earnings generation and the partial sale of its Banamex investment. The supplementary leverage ratio was 5.2%.
Book value per share increased 7% to $114.74, while tangible book value per share also increased 7% to $100.89.
The company continued to aggressively return capital to shareholders. During the quarter, Citigroup returned approximately $5 billion through dividends and share repurchases and announced a 12% increase in its quarterly dividend beginning in the third quarter of 2026. Management also continues to execute against its previously announced $30 billion share repurchase program, with total buybacks in 2026 expected to exceed 2025 levels.
Outlook for Full Year 2026
Looking ahead, management expects net interest income excluding Markets to grow between 5% and 6% during 2026, while fee momentum in Services, Banking and Wealth should continue to support non-interest revenue growth. Citi continues to target a return on tangible common equity of 10% to 11% for full-year 2026. Efficiency ratio is expected to be around 60%.
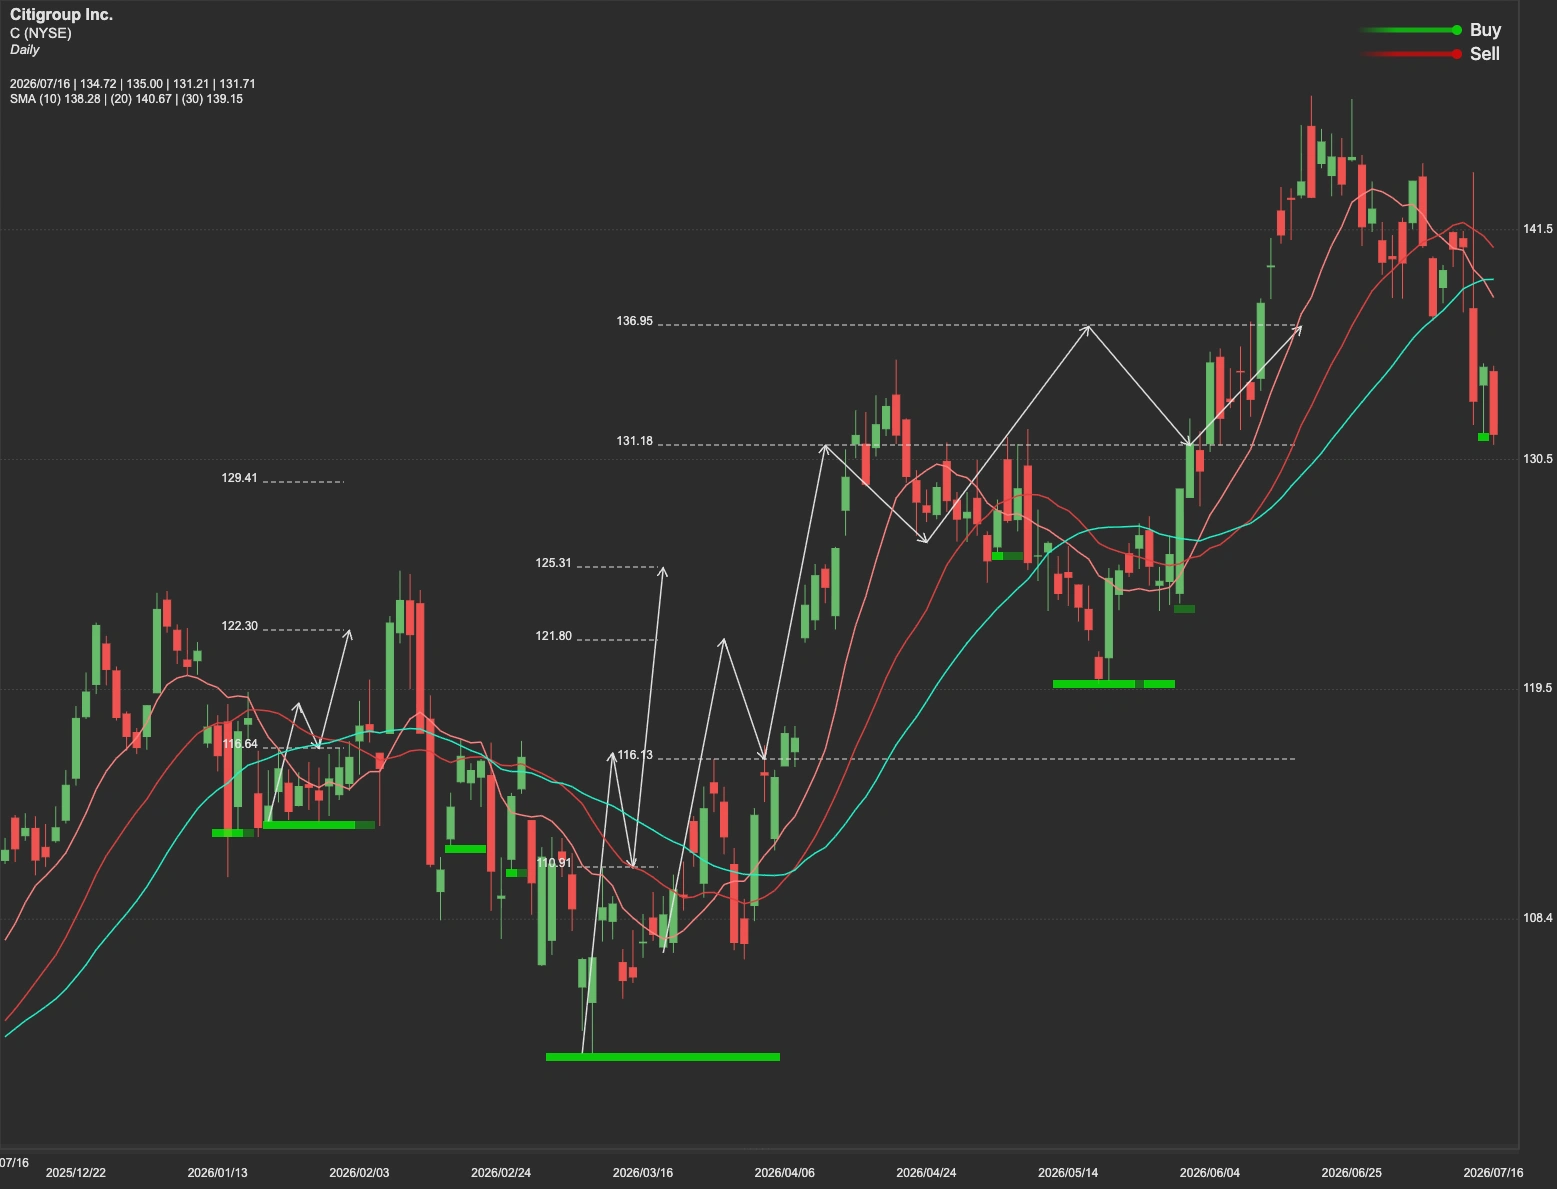
C Stock Technical Analysis
From a technical perspective, the primary resistance level sits near $150 for C stock. A decisive move above the $150 resistance zone would likely confirm a continuation of bullish momentum and could open the path toward the next major upside target around $177.
However, if buyers fail to establish support above resistance, profit-taking could trigger a pullback toward the first major support near $122. Should broader market conditions weaken or financial stocks come under pressure, investors should monitor the deeper support region between $113 and $100.