
Lowe’s Q2 2026 Earnings: Sales Grow but Margins Thin
Lowe’s Companies, Inc. (NYSE: LOW) delivered a mixed but resilient second quarter of fiscal 2026, with sales growth and continued momentum in its Pro, online and home services businesses helping offset persistent weakness in discretionary DIY spending. The results marked the company’s fifth consecutive quarter of positive comparable sales, although profitability remained under pressure from a lower gross margin.
Sales Growth Supported by Pro and Online Demand
Lowe’s reported second-quarter sales of $26.0 billion, up 8% from $24.0 billion in the prior-year quarter. Comparable sales for the quarter increased just 0.2%, reflecting strong performance in Pro and home services, as well as a 15.7% increase in online sales. These gains were partly offset by continued pressure on DIY demand.
Profitability Remains a Key Watchpoint
Gross profit increased to $8.58 billion from $8.10 billion a year earlier. However, gross margin declined to 33.04% from 33.81%. Operating income rose modestly to $3.55 billion from $3.47 billion, yet operating margin fell to 13.67% from 14.48%. The margin contraction reflects the continued pressure on profitability despite higher sales.
Lowe’s reported net earnings of approximately $2.4 billion, with diluted EPS of $4.27, unchanged from the second quarter of 2025. The company recorded $96 million in pre-tax expenses related to its acquisitions of Foundation Building Materials (FBM) and Artisan Design Group (ADG). Excluding those costs, adjusted diluted EPS increased 1.6% to $4.40 from $4.33.
Both reported and adjusted diluted EPS benefited from an $0.11 contribution from IEEPA tariff refunds.
"Sustained growth in Pro, Online and Home Services led to our fifth consecutive quarter of positive comp sales, despite pressure in discretionary DIY spending," stated Marvin R. Ellison, Chairman, President, and CEO. "While the near-term remains dynamic, our teams are executing at a high level, advancing our Total Home strategy and investing to drive growth and profitability."
Cash Flow and Balance Sheet
Lowe’s generated $7.01 billion in operating cash flow during the first six months of fiscal 2026, compared with $7.61 billion in the comparable period last year. Capital expenditures totaled $1.06 billion. Free cash flow — operating cash less capital expenditures — declined to about $5.95 billion from roughly $6.60 billion.
At July 31, 2026, Lowe’s held $3.17 billion in cash and cash equivalents and carried total debt of $37.56 billion. Long-term debt rose to $35.20 billion from $30.55 billion. The company continues to run a shareholders' deficit of $7.44 billion.
Despite the leverage, Lowe’s continues to prioritize shareholder returns. The company paid $673 million in dividends during the second quarter. Furthermore, The home depot, another home improvement retailer, recently released its Q2 FY26 financial results, more information visit: Home Depot Tops Q2 Estimates and Rolls Out 3-Hour Delivery.
Lowe’s Cuts Full-Year 2026 Outlook
Lowe’s narrowed and reduced several elements of its fiscal 2026 guidance, reflecting first-half performance and current demand trends. The company now expects total sales of $92.0 billion, compared with its previous range of $92.0 billion to $94.0 billion.
Comparable sales are now expected to be flat year over year, compared with the previous forecast of flat to up 2%. Lowe’s expects an operating margin of 11.2%, compared with the previous range of 11.2% to 11.4% and an adjusted operating margin of 11.6%, compared with the previous range of 11.6% to 11.8%.
The company now forecasts diluted EPS of approximately $11.75 and adjusted diluted EPS of approximately $12.25, both at the bottom of their previous guidance ranges. Capital expenditures are expected to reach up to $2.5 billion. Net interest expense is expected to reach approximately $1.6 billion for the full fiscal year.
Fiscal year 2026 outlook also includes tariff refunds recognized during the second quarter and excludes any potential additional tariff refunds in the second half of the year.
LOW Stock Technical Analysis
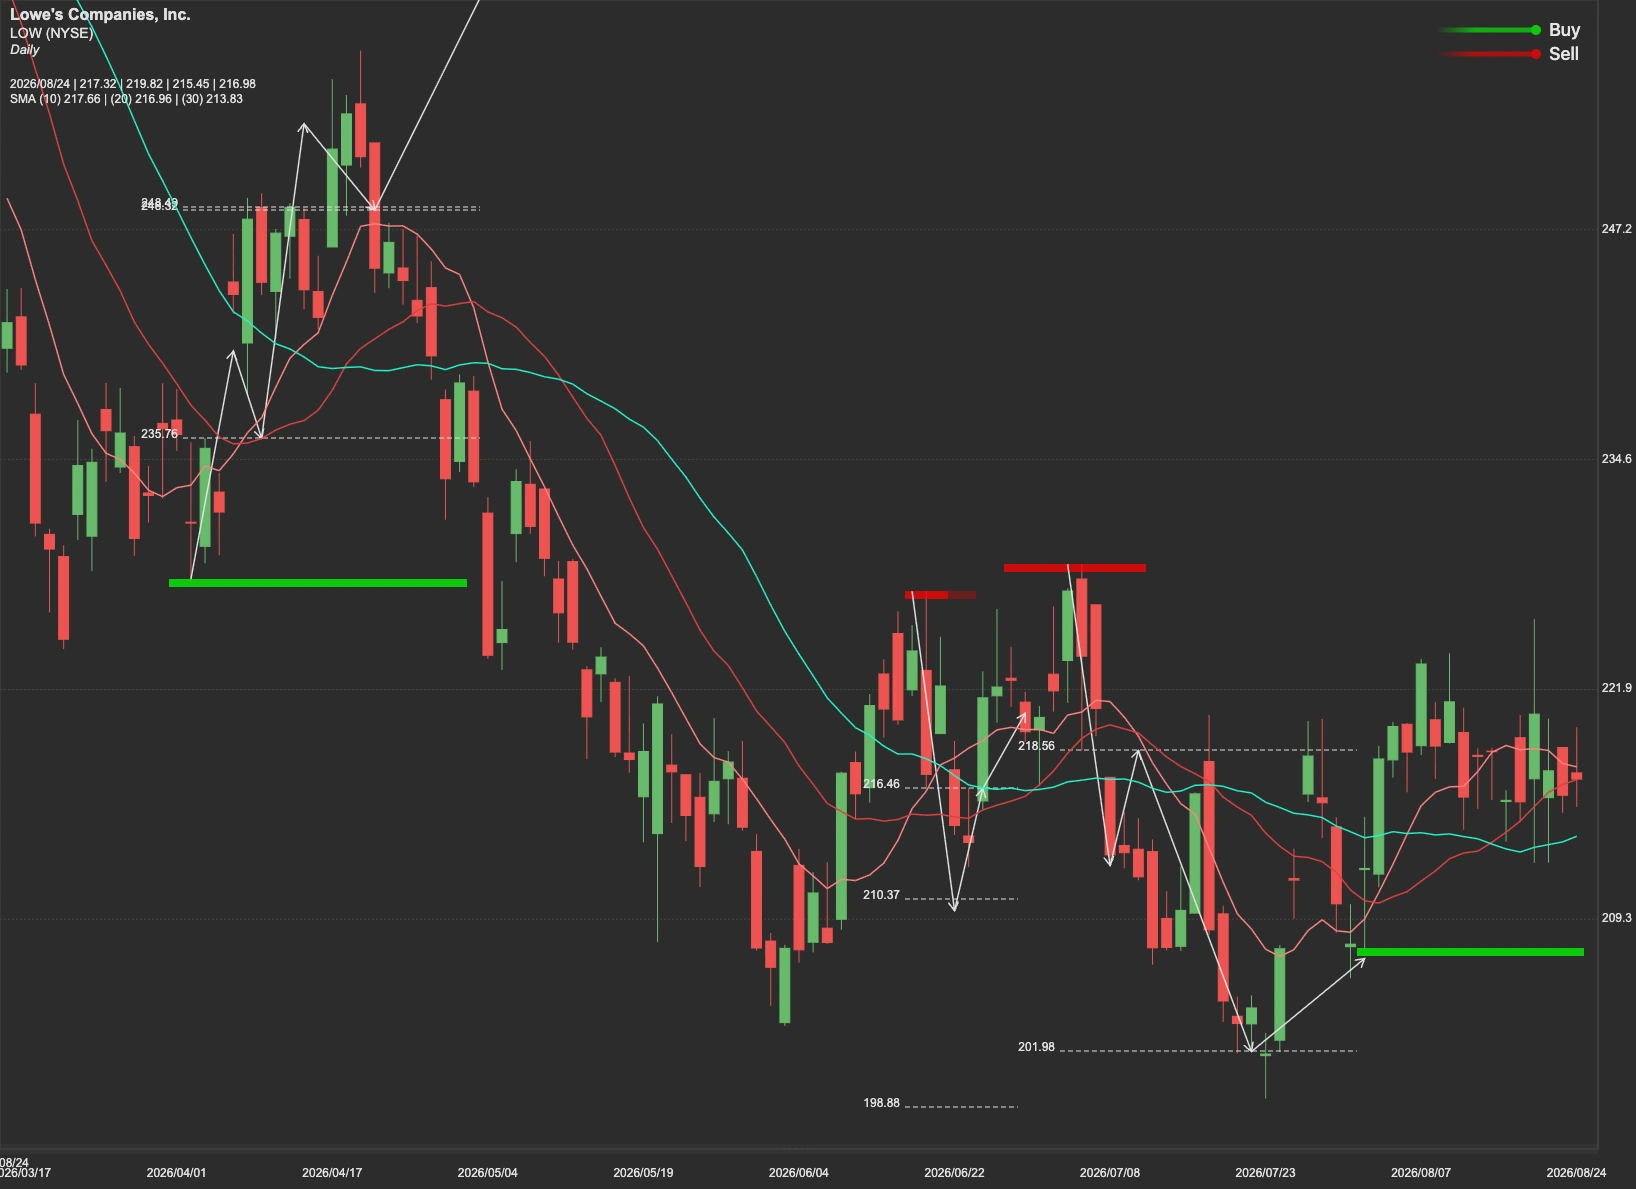
From a technical perspective, $243 is the key resistance level for LOW stock. A sustained move above $243 would strengthen the bullish setup and could open the way toward the next major resistance around $260.
Conversely, if LOW fails to break and hold above $243, selling pressure could push the stock toward the first major support near $198. A decisive break below $198 would weaken the technical picture and expose the next support zone around $182–$172.